
This morning we hooked up with the Zona Research Lab crew here at the Ukpeagvik Inupiat Corporation (UIC). This is one of MANY research groups here in the Barrow and the North Slope Borough. This land is leased by the UIC from the CH2M Polar Services for scientific research. Since the 1970s, scientists have been coming to Barrow to study all aspects of the coastal tundra ecosystem.
 Today, a handful of miles north of the town of Barrow one can easily see metal towers dotting the seemingly flat landscape along the coast of the Arctic Ocean. These towers collect data on current atmospheric conditions. This is where we meet with a NOAA researcher who gives us the tour of his site. We enter into a small 4 room building and climb a set of stairs to the roof where a few of the data-gathering instruments are located. A very tall tower stands to the east. It is explained that these towers collect gas samples and the amount of gas in the atmosphere a certain distance away is measured. Gases such as carbon dioxide*, methane, and various greenhouse gases are measured as the air passes by the instruments’ sensors. Measurements are taken 10 times per second, resulting in huge amounts of data. Albedo (reflection) is also measured.
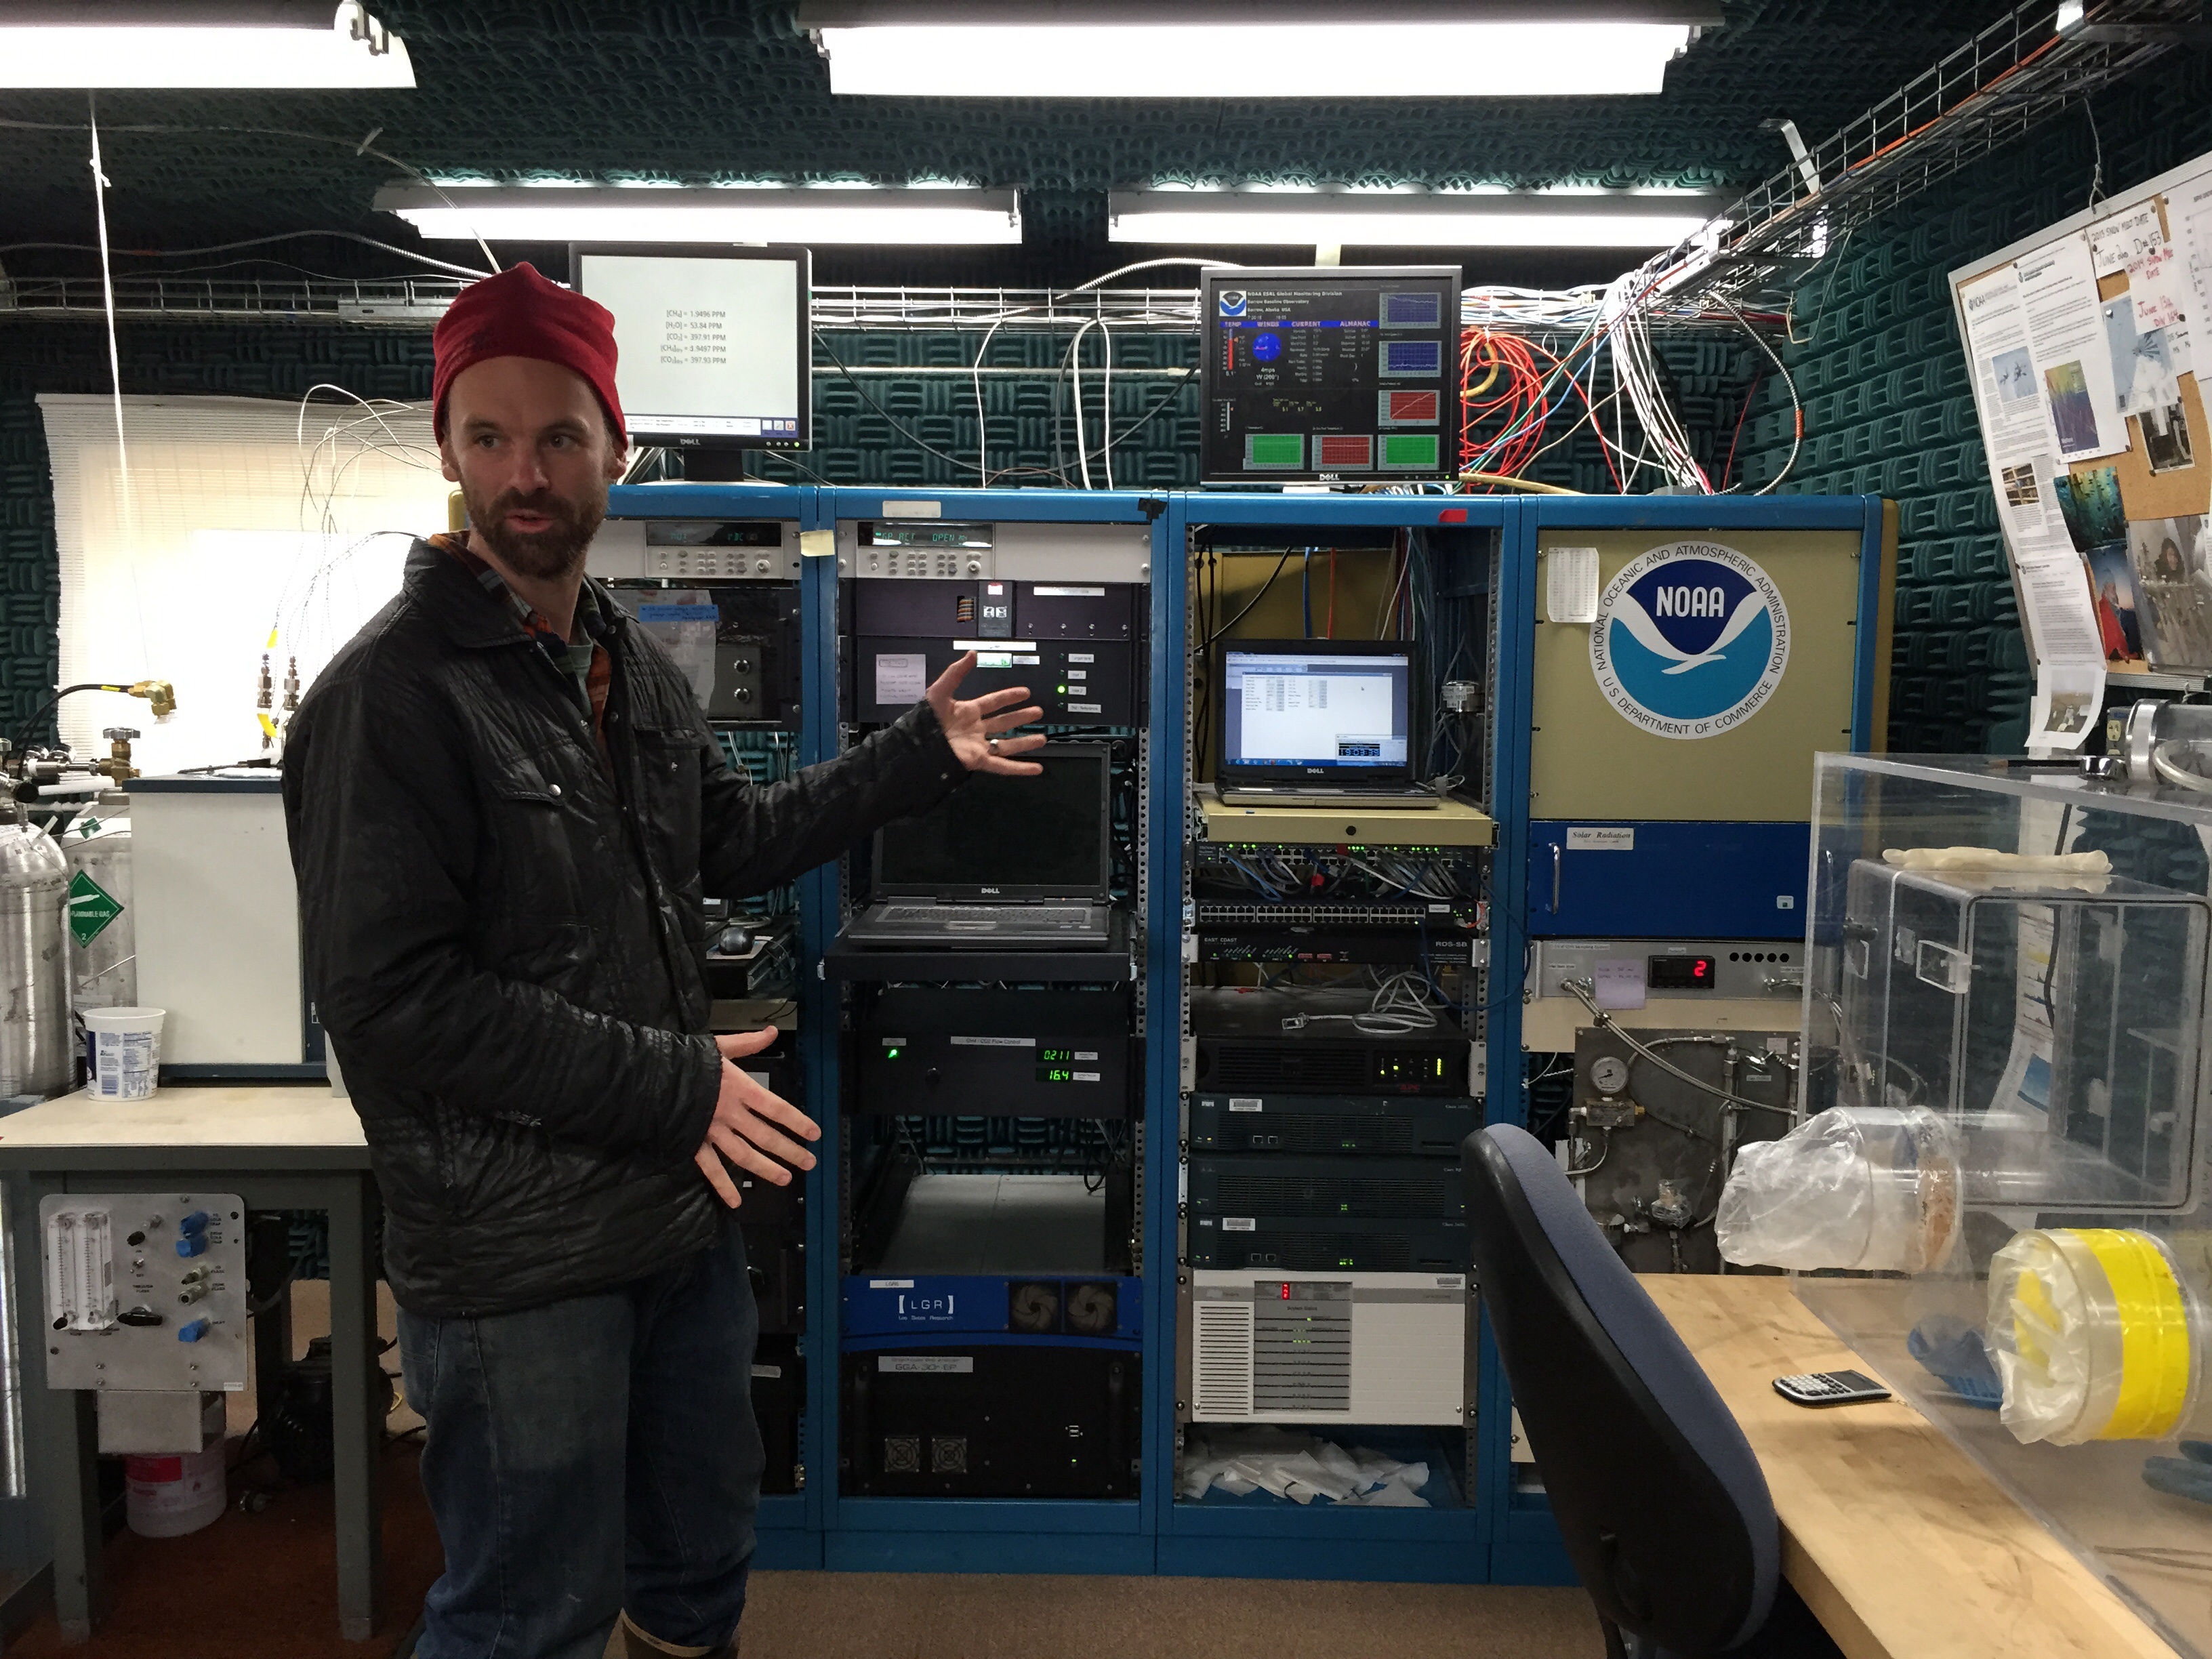
 Back inside, we enter a very warm room filled with laptops all connected to the instruments outside by a maze of wires. Screens show the raw data coming in, and at the same time, the data is stored on various hard drives and in programs that will be used to analyze and interpret these data.
A short walk to the south across the tundra, we arrive at the Zona Lab group’s tower. Here they measure CH4 and CO2 flux emissions which will add to knowledge about terrestrial contributions of this ecosystem to climate change. This tower is small and wires run into what looks like a giant blue cooler that houses the computer collections and recording the data. From the computer living in this box, the data is transmitted to a computer back at the main laboratory a few miles away. Here, graduate students and post docs receive the data on their computers and work on it right away.
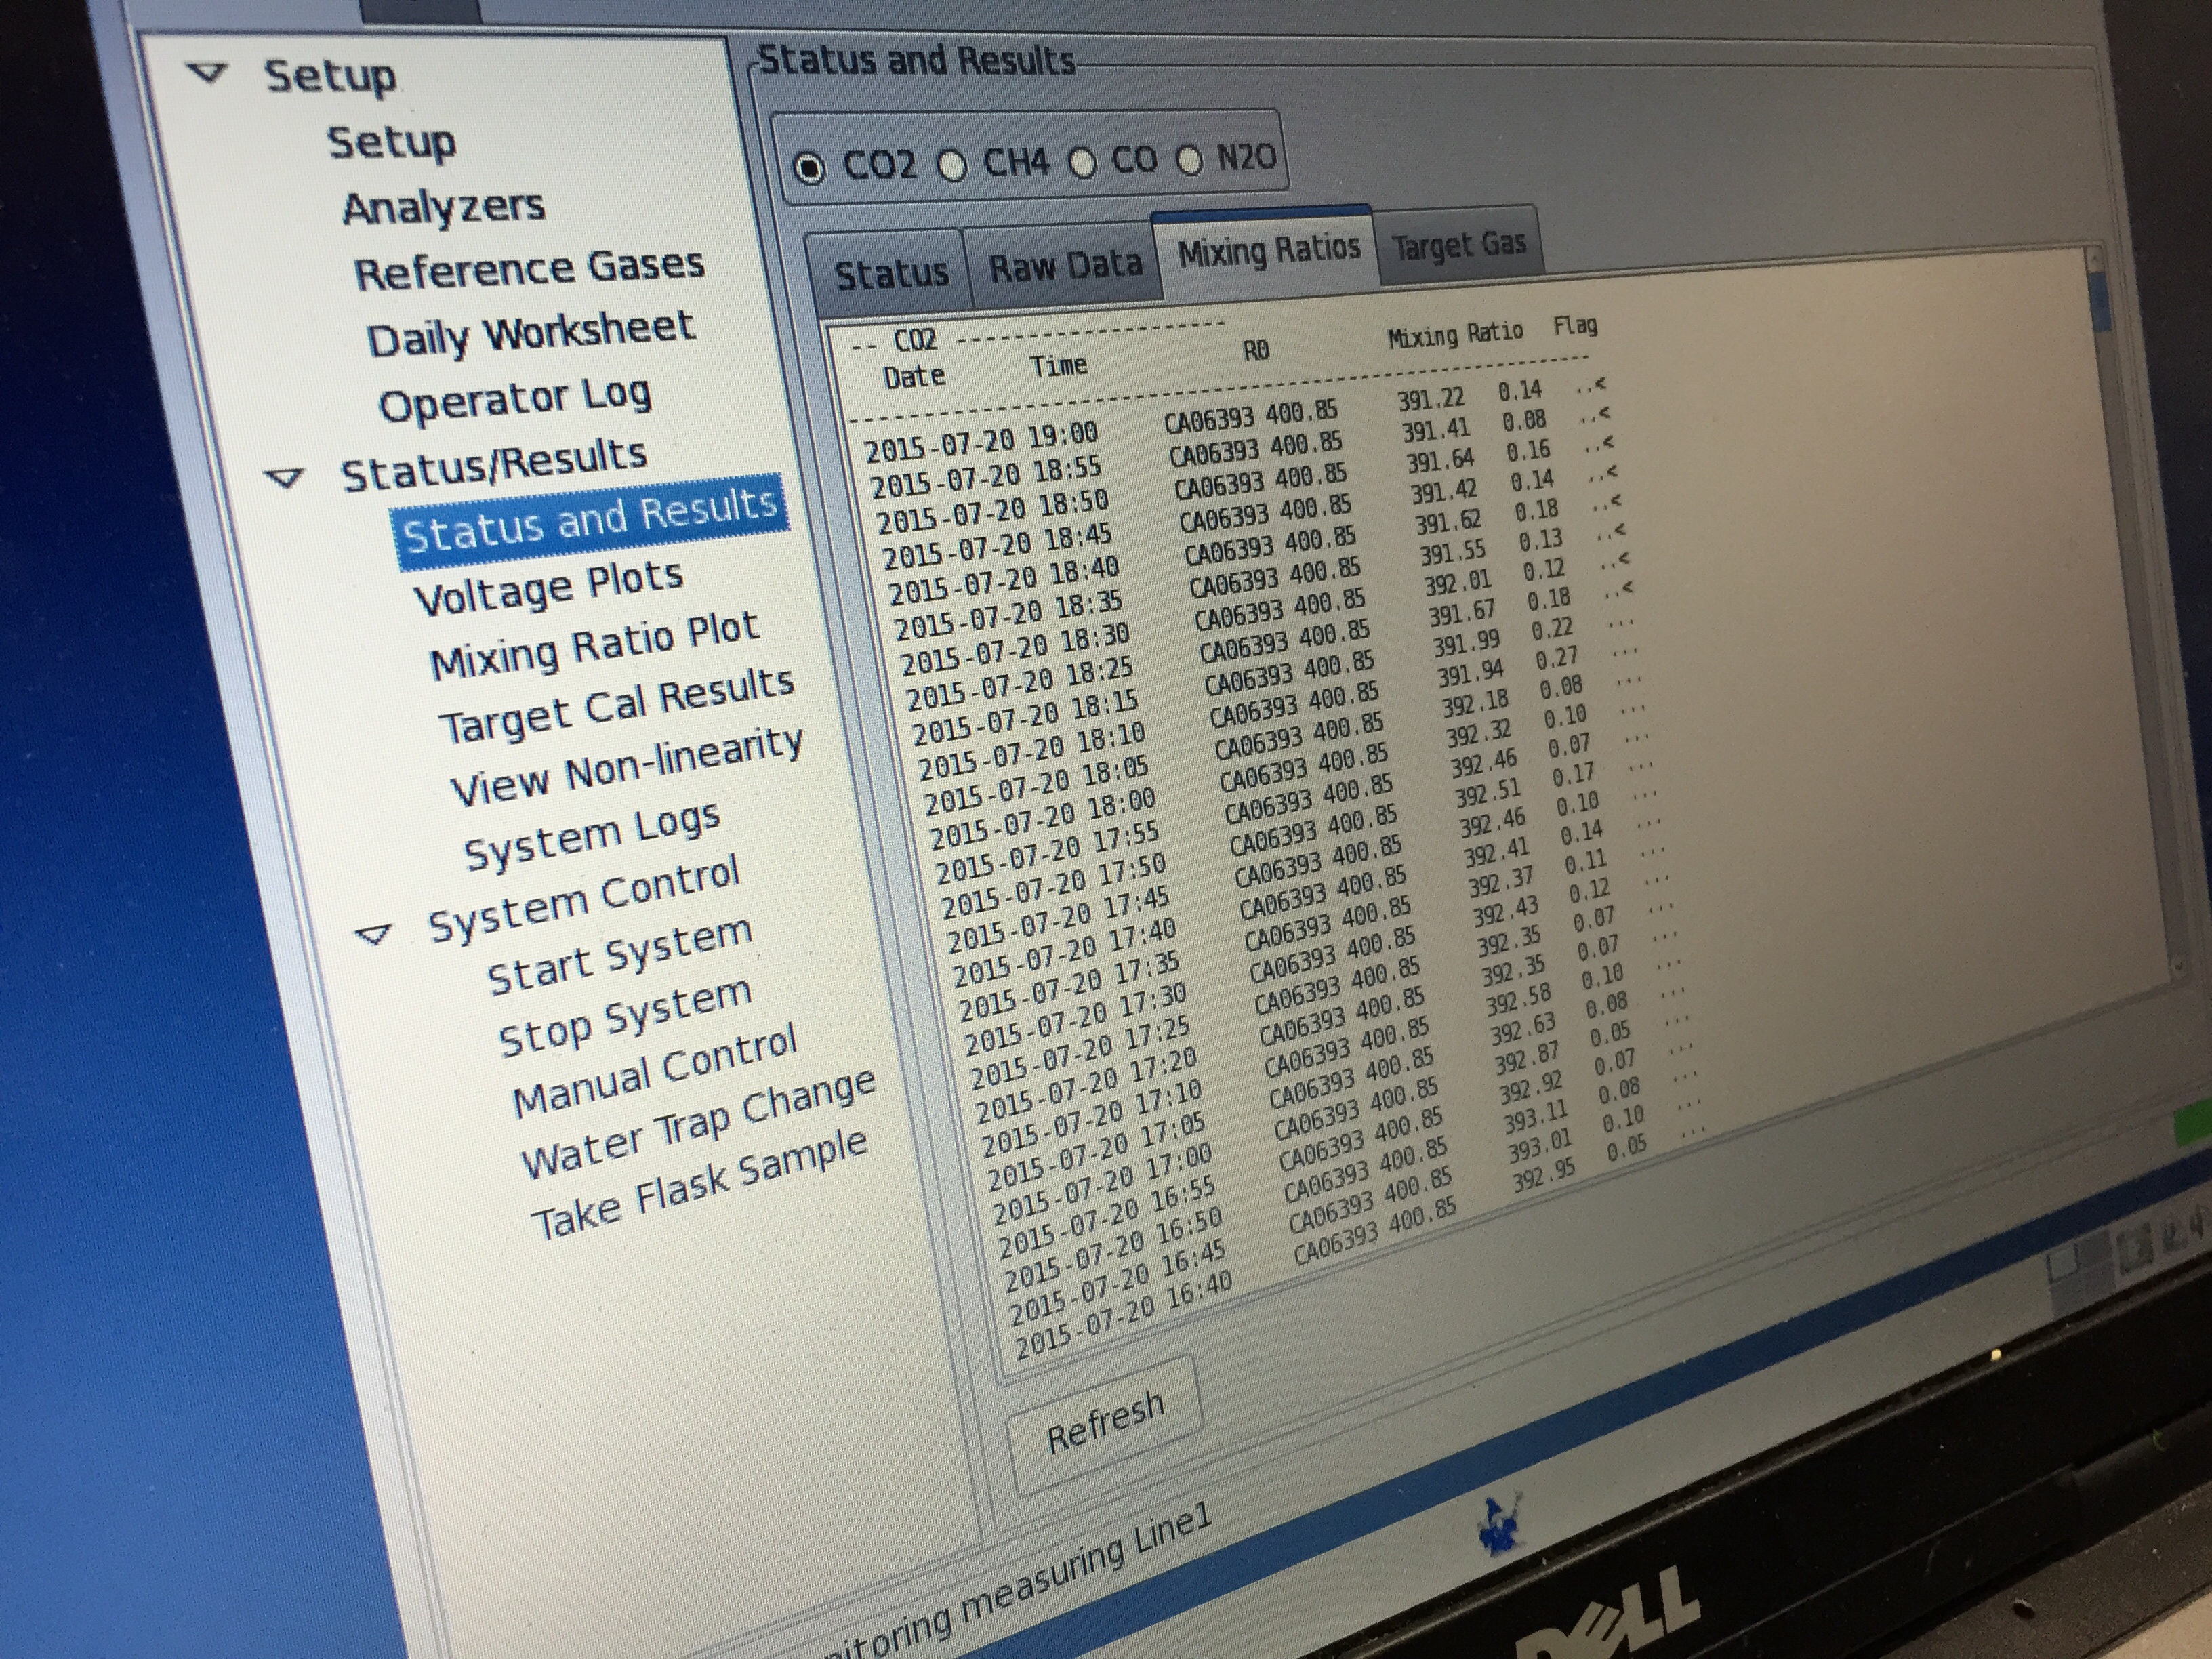
 We are shown raw data and we are shown graphs that are produced from the data. As science educators, we are thinking of ways to use what we have learned, and brainstorm with the Zona Lab group about what data would be usable in K-12 classrooms. They are excited to work with us and be involved in educating youth with real data. We part with happy thoughts and good feelings about future communications through which we will work to engage students in the study of atmospheric and climate sciences.
*In case you were curious, the CO2 readings while we visited were hovering at 392 ppm which is the lowest they have had this summer. They have recently started to drop because primary plant production has stopped (in other words, plants are no longer growing and respiring as much as the season turns to fall).
